FADA Sales Report August 2024: CV Segment Experienced decline of 6.05% YOY
By Priya Singh
3815 Views
Updated On: 05-Sep-2024 12:27 PM
According to the latest FADA Sales Report, combined CV sales totalled 73,253 units in August 2024, down from 77,967 units in August 2023.
Key Highlights:
- Commercial vehicle sales in August 2024 dropped by 6.05% year-over-year.
- Total CV sales were 73,253 units, down from 77,967 units in August 2023.
- Sales declined by 8.50% month-over-month from July 2024.
- Light Commercial Vehicles (LCVs) saw a 6.10% decrease year-over-year.
- Tata Motors held the largest market share at 33.88%, though it decreased from last year.
FADA, the Federation of Automobile Dealers Association, has shared the commercial vehicle sales data for August 2024. The CV segment experienced a decline of 6.05% year over year.
According to the latest FADA Sales Report, combined CV sales totalled 73,253 units in August 2024, down from 77,967 units in August 2023. Additionally, there was a decline of 8.50% in Month-on-Month (MoM) sales compared to July 2024, when 80,057 units were sold.
Commercial Vehicle Sales in August 2024: Category-Wise Breakdown
Light Commercial Vehicles (LCVs)
In August 2024, the LCV segment sold 42,496 units, down 6.26% from July 2024, which recorded 45,336 units. On a year-on-year basis, LCV sales declined by 6.10% compared to 45,257 units in August 2023.
Medium Commercial Vehicles (MCVs)
The MCV segment sold 6,137 units in August 2024, marking a 13.85% drop from July’s 7,124 units. Compared to August 2023, when 6,173 units were sold, the sales decreased slightly by 0.58%.
Heavy Commercial Vehicles (HCVs)
HCV sales stood at 21,221 units in August 2024, showing an 11.82% decline from the 24,066 units sold in July. Year-on-year, the segment dropped by 8.19% compared to 23,114 units sold in August 2023.
Others (Small Commercial Vehicles and Other Segments)
In this category, 3,399 units were sold in August 2024, down 3.74% from July 2024's 3,531 units. The year-on-year change was minimal, with a 0.70% decrease compared to 3,423 units sold in August 2023.
Each category has seen a sales drop, highlighting industry-wide challenges.
OEM Wise CV Sales Figures
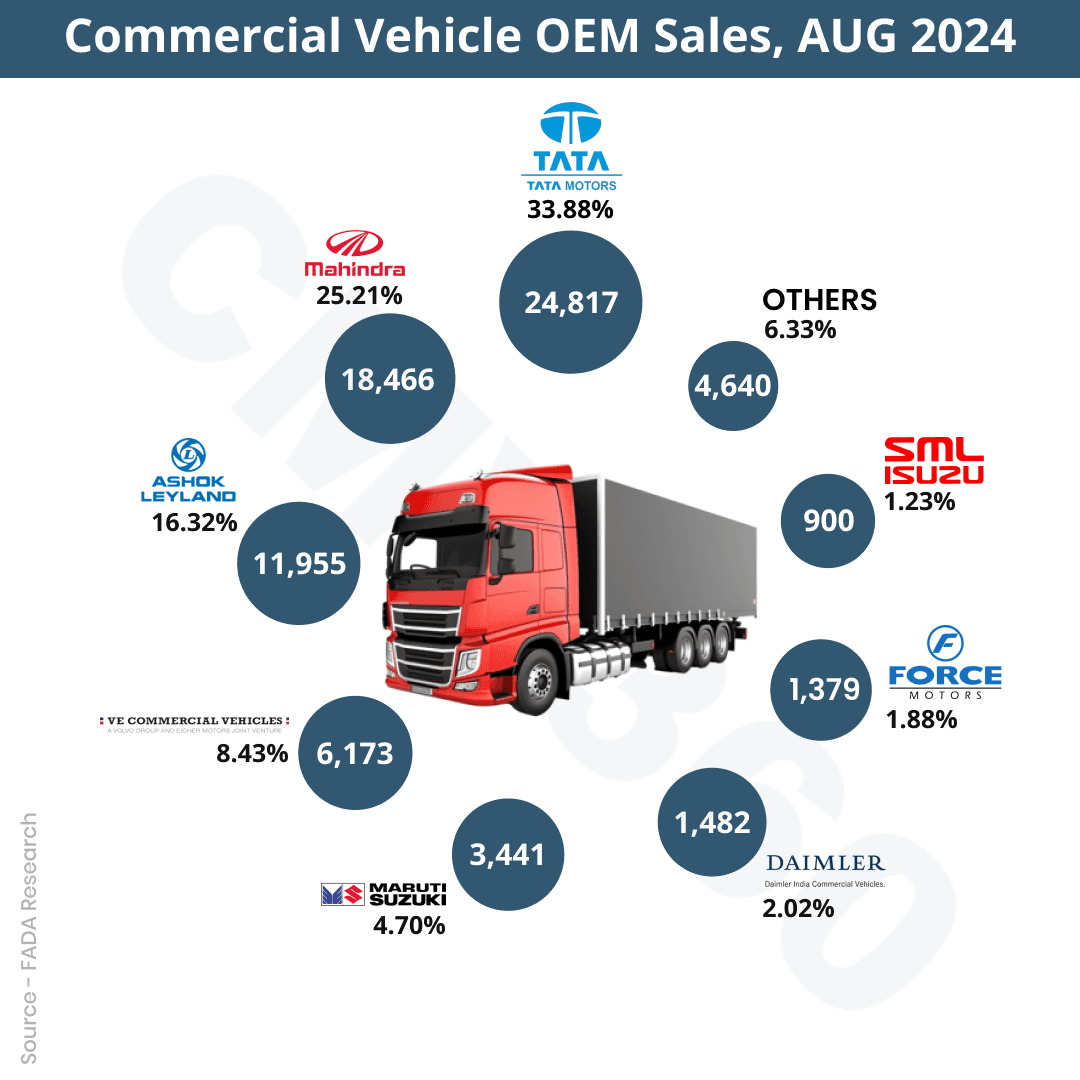
In August 2024, Tata Motors Ltd hold a 33.88% market share with 24,817 units sold, down from 36.17% in August 2023 when they sold 28,198 units.
Mahindra & Mahindra Limited achieved a 25.21% market share. In august 2024, the company sold 18,466 units, compared to 19216 units sold in August 2023.
Ashok Leyland Ltd secured a 16.32% market share. In August 2024, the company sold 11,955 units, compared to 12,136 units in August 2023.
VE Commercial Vehicles Ltd improved its market share to 8.43% with 6,173 units sold, compared to 7.33% and 5,717 units in August 2023.
Maruti Suzuki India Ltd experienced market share increase to 4.70% with 3,441 units sold, up from 4.20% and 3,277 units in August 2023.
Daimler India Commercial Vehicles Pvt. Ltd also saw a rise in market share to 2.02%, selling 1,482 units compared to 1.93% and 1,503 units last year.
Force Motors Limited’s market share decreased slightly to 1.88% with 1,379 units sold, down from 1.96% and 1,527 units in August 2023.
SML Isuzu Ltd experienced a small increase in market share to 1.23%, with 900 units sold compared to 1.15% and 895 units last year.
The ‘Others’ category saw its market share fall to 6.33% with 4,640 units sold, down from 7.05% and 5,498 units in August 2023.
Overall, the total commercial vehicle market in August 2024 consisted of 73,253 units, reflecting a decline from 77,967 units sold in August 2023.
Also Read: FADA Sales Report July 2024: CV Segment Experienced growth of 5.93% YOY.
CMV360 Says
The drop in commercial vehicle sales for August 2024 reflects a tough market environment for the industry. Tata Motors' decline in market share indicates increased competition, while Mahindra & Mahindra and Ashok Leyland have made modest gains. This situation emphasizes the need for manufacturers to stay agile and responsive to market shifts to remain competitive.